This is how the model that drives the Salary Compass has been built

Our brand new Salary Compass HAS SEEN THE LIGHT OF DAY. In case you haven't checked it out yet or don't know what the M we are talking about, head over to our post where we give you the lowdown.
The Salary Compass is a salary benchmark tool that enables you to gauge your financial position within the tech job market and compare your profile with other similar ones.
It works thanks to the data of over 25,000 Manfredites who have consciously entrusted us with their precious information.
Want to know more about the mechanism of the data model that drives it? POST IN!
// How the model is built
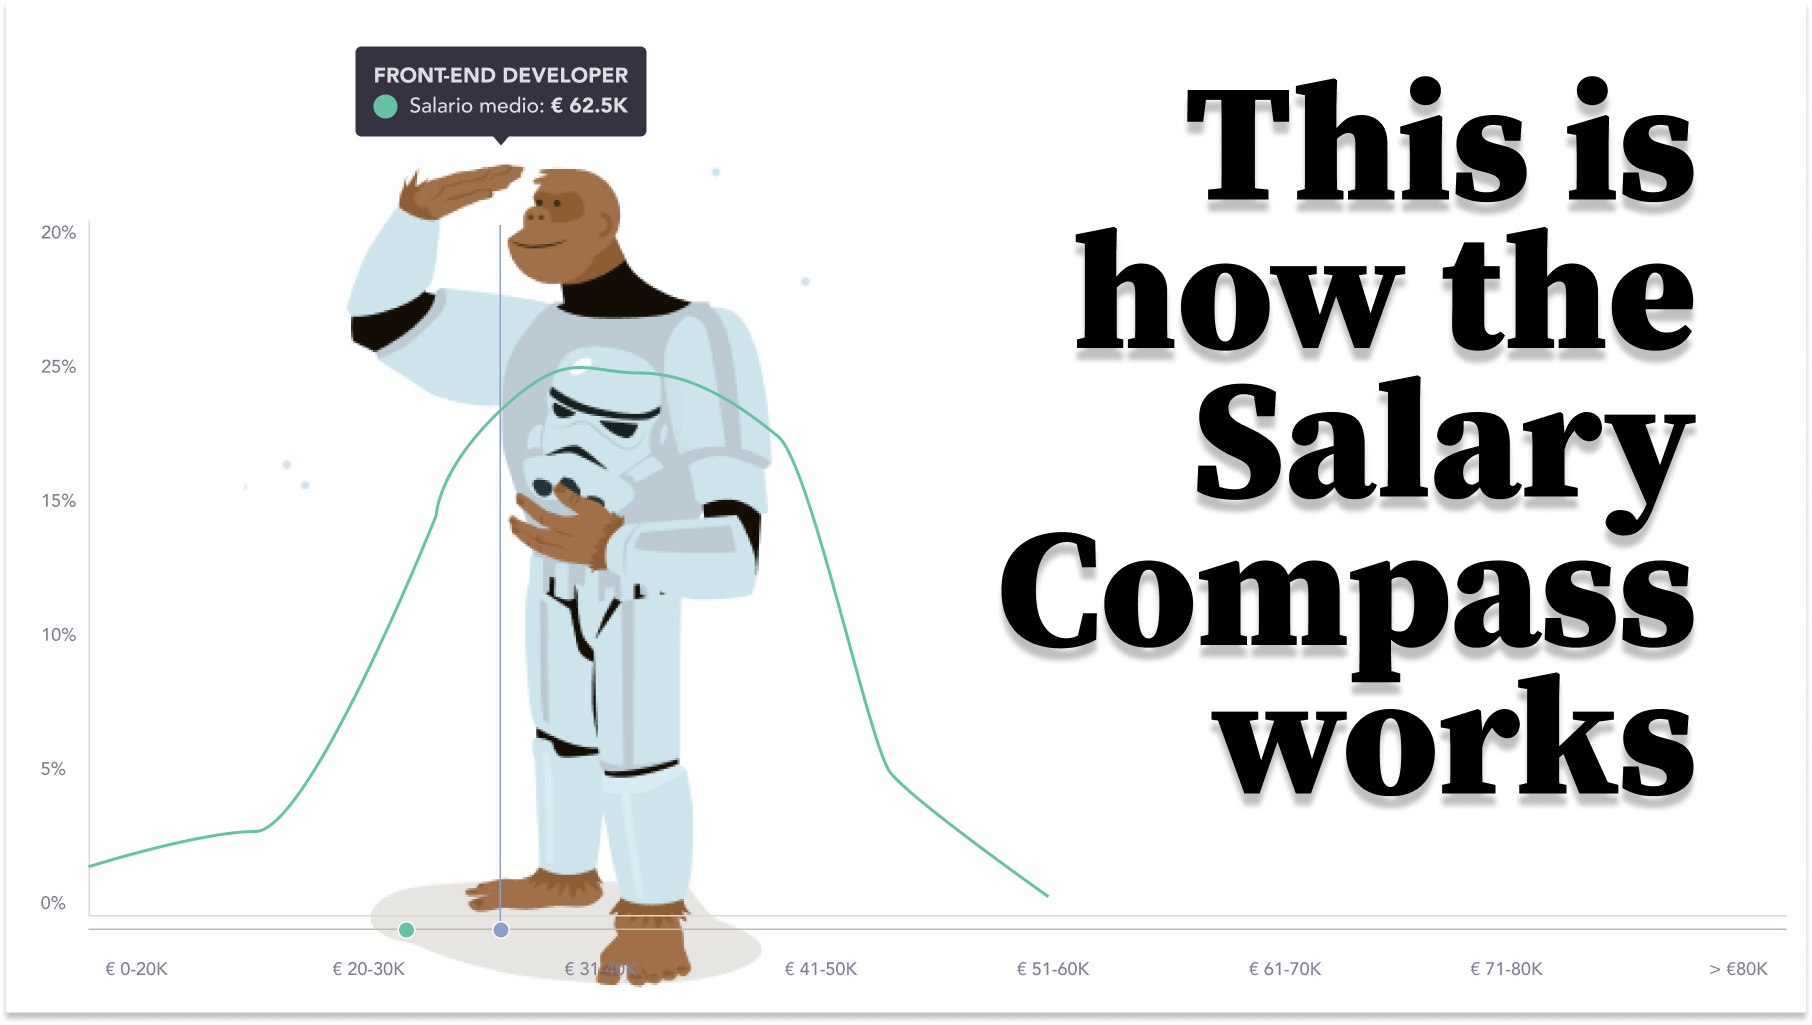
The system used to build the compass is based on a traditional probability density function. However, it is not just a distribution. In the following lines we will tell you why, what decisions we have made in the evolution of the product and how we have overcome the various obstacles.
Here, then, is the chronology of development!
// An overview of timeline and decision-making along the way
Initially, the idea was to approach it as a Machine Learning model. We discovered, however, that there would be a major problem with the explainability of the model. That is, the model would return a result with a margin of error and a black box effect, which we would prefer to avoid in order to give the user more transparency and a better ability to interpret the results.
At that point, it became a more visual tool. For each use case, the distribution of probability of earning some amounts or others is shown. Thus, by showing you a graph in which you see, for each salary range, the probability that you have of earning it, it generates a more accessible and honest interpretation, since it does not include any data modeling.
In the simplicity of the tool lies the honesty of its data and the accountability to the person using it: what you see is both the outcome and the probabilities of achieving other outcomes.
What we aspired to build is a distribution with a logical layer on top. What for? To ensure the robustness of the data. So that we don't show data that we have too little data on and therefore give strange results.
We have validated that the distribution of the statistics corresponds to the type of distribution we want. Analyzing the database, we came to the conclusion that when we went below about 130 samples, the statistics started to diverge. Therefore, we concluded that the stable results should be above that number. Until 200 samples of a datum are obtained, they are not taken into account.
Thus, the doubt seems to be key: in this conception it is very likely that there are relevant characteristics, which impact the salary, but are ignored because there are not enough samples.
And the answer is: yes. To rescue characteristics that are relevant, but we have skipped them when creating the initial distribution, we have implemented a backtracking mechanism. Simplifying a bit, for this, we create different data sets and, seeing the resemblance of the users of the different distributions, we modify the original distribution. For example, let's think of a Backend Developer with 10 years of experience, with Java and Spring experience and speaks English, but in this particular case, English is a feature that has been left out of the initial distribution. The backtracking logic will try to build a distribution based on similar profiles that include English and will calculate the impact of English on the salary in order to compute it in the final result.
// Data validation
Our main concern has always been that the data to be offered should correspond to a realistic view of the market.
That the compass works on real data, those of the people in our database, is a first step. However, in order to be sure that the results shown correspond to reality, we have carried out several validation phases.
In the first phases, the results were compared with those obtained in reports by other companies in the sector, such as Randstad or Hays. These comparisons allowed us to identify misaligned archetypes and adjust them.
We have also built our own internal archetype system. Both in collaboration with several of our Scouts, with whom the models have been validated, and through the construction of a system of archetypes, which you can learn more about HERE, we have managed to adjust the results to the reality of the Spanish technical market.
The validations have served to analyze phenomena such as grouped roles. In these analyses we discovered that there were some roles, such as Frontend-Backend-FullStack or Product Manager-Project Manager, that gave very similar results. What was happening is that many of the people in our database have multiple roles and an overall desired salary. In addition to monitoring results, adjusting archetypes, we can and have in mind to limit roles, in some way.
// What data is requested and why
To access The Salary Compass, four pieces of information are requested at the start:
- Role / Positions you are interested in carrying out
- Salary you aspire to earning
- Salary range you are earning
- Geographical location where are you based
- Languages you can speak
- Technologies you work with / you can work with
These data fields are the most frequently recurring when modelling a salary income, or the process of negotiating a new salary package. Requesting these data fields is also influenced by the fact that it is information that already exists in many of the Profiles within the Manfred database, so it was the best option to get The Salary Compass up and running using existing data.
Information that we don't currently have that we think could be beneficial to the tool will be added in future releases. For example, how much a person is currently earning is a very relevant data for this Compass to offer the purest vision of the current tech industry. Other key data such as location, type and size of company currently employed at, will be added. This also is information that will not tell us much until we have accumulated a wide enough and current database.
The idea for the next steps is to accumulate this new data, although the algorithm ALREADY supports it. That is, if we have enough data in a particular category, the algorithm will input it. All the information that has been taken into account to obtain the result that the user is shown is offered on the screen itself. In this way, explainability is fulfilled.
// What happens when there is not enough or no data
This is what we discussed above. Without a sample of 200 data, we cannot ensure that the distribution we offer is robust. If the data for which we do not have enough individuals are different from location and/or role, we will simply tell you that they have not been taken into account to build the distribution.
But, if the data for which we do not have enough samples are location and/or role, we will show you a screen like this.
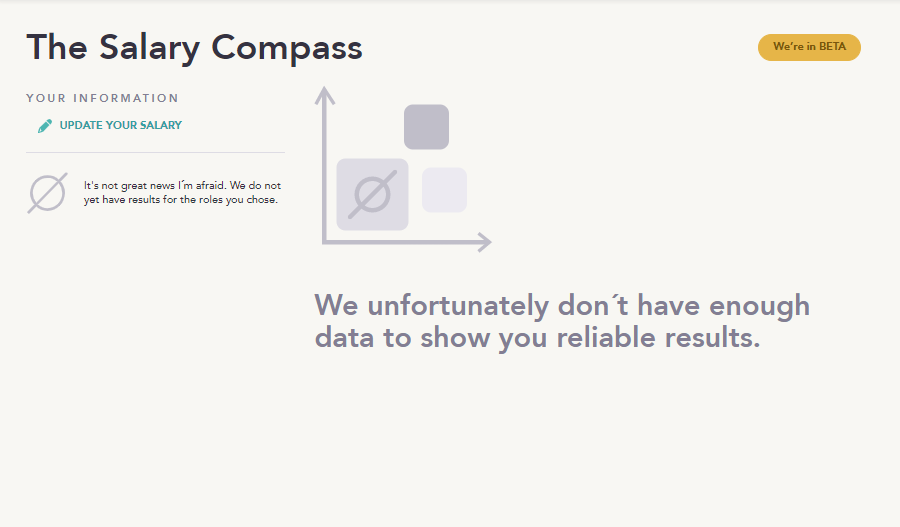
Of course, the model is you. In that case, we will ask you to leave us your details and we will let you know when we have the information available for you.